On November 13, 2017, an epidemic of hypertension broke out and could rapidly affect tens of millions of Americans. The epicenter of the outbreak was traced back to the halls of the Anaheim, CA, convention center where the annual meeting of the American Heart Association was taking place.
The pathogen was released in a special 488-page document labeled “Hypertension Guidelines.” The document’s suspicious content was apparently noted by meeting personnel, but initial attempts to contain it with an embargo failed and the virus was leaked to the press. Within minutes, the entire healthcare ecosystem was contaminated.
At this point, strong measures are necessary to stem the epidemic. Everyone is advised not to click on any document or any link connected to this virus. Instead, we are offering the following code that will serve both as a decoy and as an antidote for the virulent trojan horse.
Only a strong dose of common sense packed in a few lines of text can possibly save us from an otherwise lethal epidemic of nonsense. Please save the following text on your EHR cloud or hard-drive, commit it to memory or to a dot phrase, and copy and paste it on all relevant quality and pay-for-performance reports you are asked to submit.
PREAMBLE:
- The blood pressure is a physiologic quantity necessary for, and indicative of, human life.
- The blood pressure normally fluctuates for moment to moment. The range of values encompassed by the blood pressure is wide and depends on personal characteristics, as well as circumstances. For example, during sleep, invasively measured systolic blood pressure in healthy individuals may fall to 70 mmHg or even lower. During weightlifting, the systolic blood pressure may rise as high as 480/350 mmHg.
- Pitfalls that can potentially limit the accuracy of the measurement of blood pressure are many.
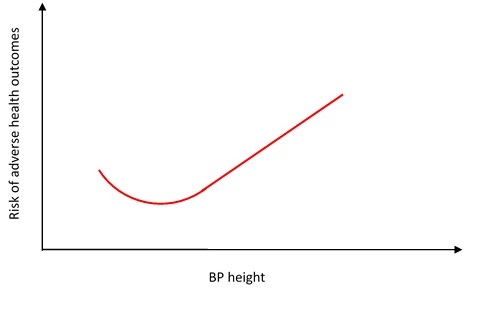
- The so-called “resting” blood pressure measured in asymptomatic individuals has statistical significance regarding the long-term health of the individual: the resting blood pressure relates to a risk of adverse health outcomes. That risk is estimated by large scale clinical studies and is modified by patient circumstances.
- The statistical relationship between the resting blood pressure and health is J-shaped.
- Because the relationship between blood pressure height and outcomes is statistical, the nadir of the J-shaped curve cannot be determined on an individual basis.
- Because the nadir of the curve cannot be determined on an individual basis, and because the relationship between the blood pressure height and risk is continuous and gradual, no specific blood pressure value or range of values can segregate “normal” from “abnormal” blood pressure.
- In the 1950s Sir George Pickering described any selection of normal values as “the fallacy of the dividing line.” It was a fallacy then, it remains a fallacy now.
HYPERTENSION GUIDELINE:
- Doctors are called to act prudently and to take into account individual patient circumstances that may impact on diagnosis and treatment (Recommendation Class: I; Level of Evidence: C).
- The guideline for the treatment of high blood pressure is to understand the above graph (Recommendation Class: I; Level of Evidence: C).


Thanks for an astute and amusing analysis. We can never have too many epidemics, it seems.
I’m curious as to which data sets included females and how different the distribution plots looked with the sexes separately analysed and graphed .